Microsoft Office 2007
Microsoft Office 2007 Free Download for PC Windows 7/10/8, 32/64-bit introducing the new versions of Word, Excel, and PowerPoint

IBM SPSS Statistics is a feature-rich suite used for solving business as well as research problems while offering various techniques such as ad hoc analysis, hypothesis testing, predictive analytics, and so on. It manages data more reliably while turning the complex or incomplete data into accurate findings.
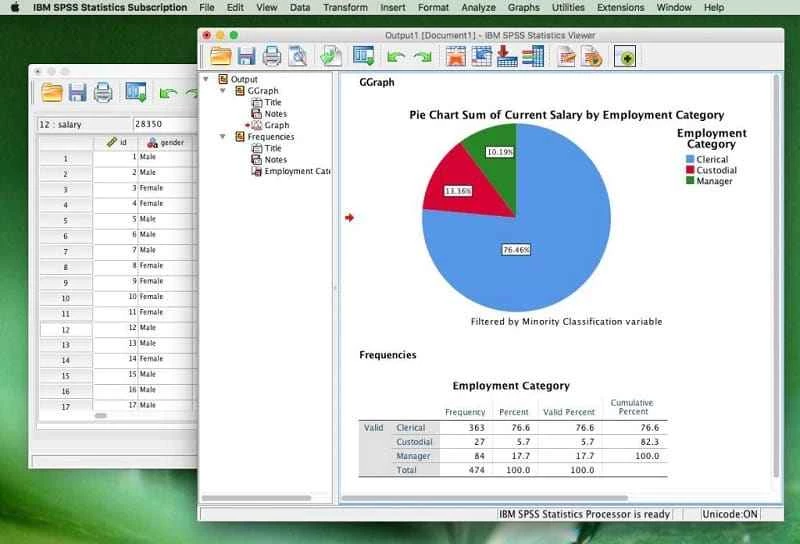
The innovative software within multiple professional tools gives you quick access to a large amount of data and manages it more reliably while using graphs and charts. It is available for Windows and Mac operating systems.
SPSS Statistics is produced by SPSS Inc., and next IBM acquired it 2009, and versions released since 2015 are called IBM SPSS Statistics. It was originally known as Statistical Package for the Social Sciences (SPSS), and later it was changed to Statistical Product and Service Solutions. It is a productivity tool used for managing everything related to data planning.
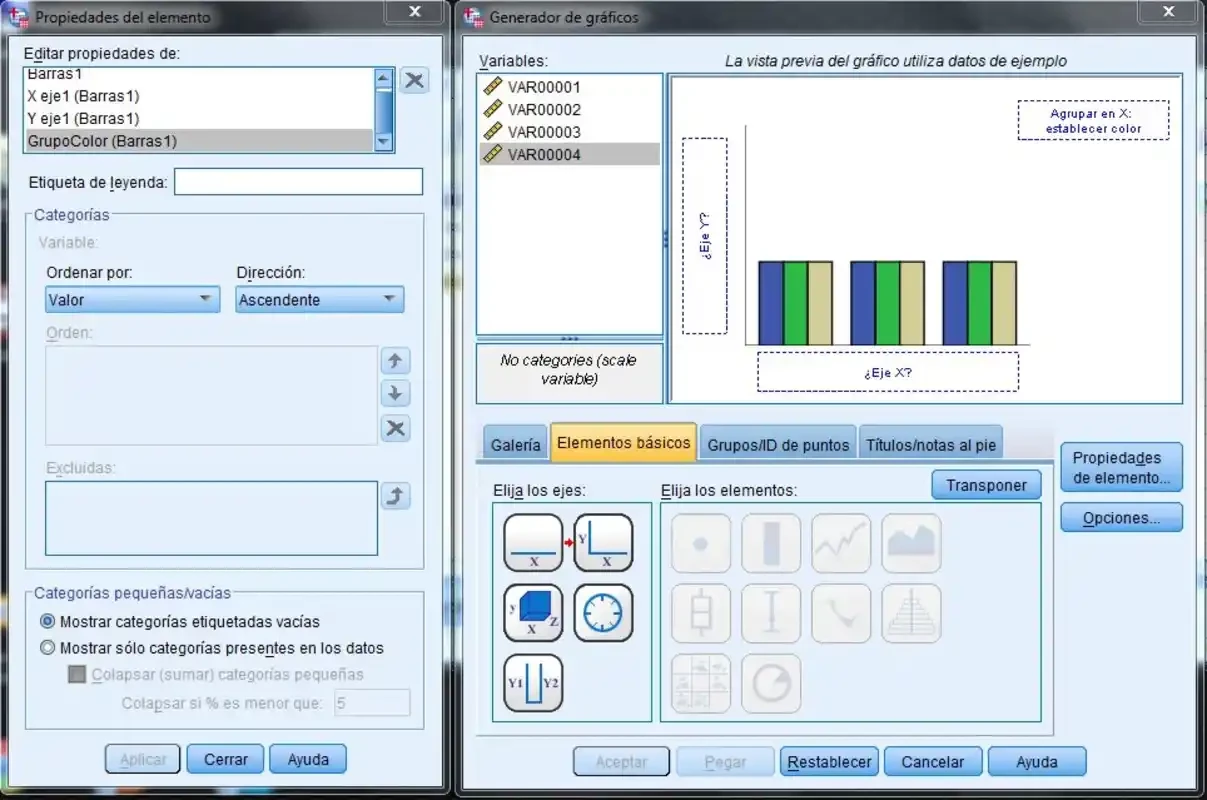
It handles as well as interprets data with multiple accessible tools and offers services for advanced analytics, data management, business intelligence, multivariate analysis, and criminal investigation. The GUI with drop-down menus and dialog boxes offers greater control while using syntax commands.
The intuitive interface offers quick access to different tasks and analyses through menus and toolbars. It very easily caters to data exploration, visualization, and analysis. You can customize the interface according to your preferences. After installation, you have to select a license and enter the key to activate it. It offers a simple process of managing your data, such as;
The software allows access to different features using pull-down menus, and also 4GL command syntax language for programming. You can also simplify repetitive tasks, handle complex data manipulations, reproduce output, and analyze. So, you have to use syntax programming for accessing some complex applications, instead of a menu structure. However, you can use a pull-down menu for generating command syntax, and you can view it in the output, but you need to change the default settings to make it visible. You can use the generated syntax commands in a syntax file using the Paste button available in each menu.
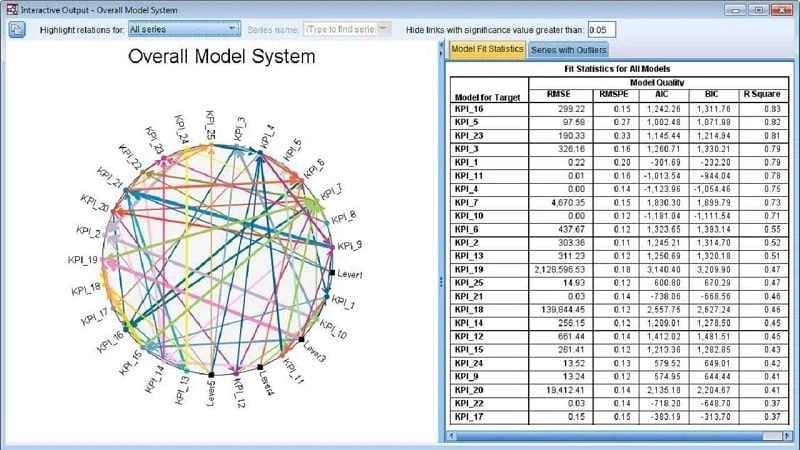
The software is equipped with high-class predictive models and regression, such as linear regression, logistic regression, decision trees, and neural networks. It allows you to precisely predict future outcomes and trends, and identify as well as target the specific customer segments. In this way, it maximizes campaign effectiveness and ROI (return on investment). It is the best solution for market researchers for handling complex samples and addressing missing data within fool-proof outcomes.
Supporting multiple formats, such as SQL exclusively non-exportable format, which saves your data on an MS Excel sheet, plain text, SAS, and Stata. PDF, HTML, MS Word, and some other output options that help you to copy charts and paste them into another document.
The support for Python programmability extension is capable of creating command syntax programs while using the information in the data dictionary. The extension has replaced the SAX Basic script, which was less functional for multiple purposes; however, it is still available. You can use it for running SPSS on of the statistics in the free software package. It is possible from version 14 of SPSS to run Python or a VB.NET program using the available plug-ins.
You can simplify complex data tasks while using multiple advanced statistical analyses, and multiple advanced tools are available for data preparation as well as custom table creation. It allows the uncovering of trends and complex relationships while using advanced techniques such as bootstrapping. In addition, use foundational statistical methods, regression, or other advanced methods, including bivariate, factor, and cluster analysis with automation for data analysis.
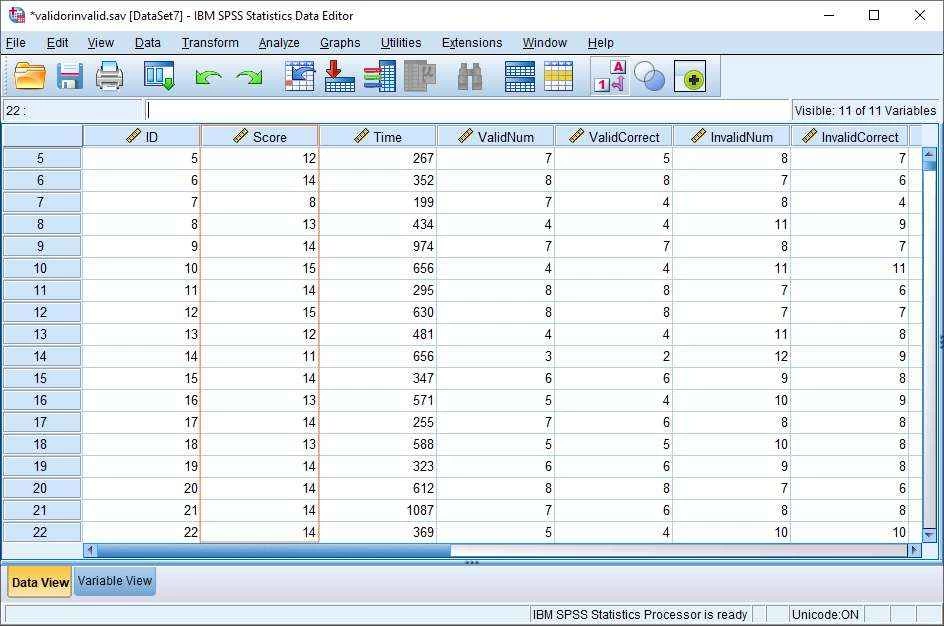
It offers a two-dimensional table structure, including rows for representing cases and columns for representing measurements. Numeric and string (text) are available for defining your data, and the entire processing of data takes place case-by-case through the file. The matching of files is available in various ways, such as one-to-one, one-to-many, and many-to-many. Moreover, an exclusive Matrix session enables users to use linear algebra operations and matrices for processing data.
The software is available within both licenses: shareware and freeware. It's up to you which type of license better suits you. You have the option to go with a free trial version for 14 days, and decide whether to get a subscription or not. It offers different plans such as;
Pros
Cons
Microsoft Office 2007 Free Download for PC Windows 7/10/8, 32/64-bit introducing the new versions of Word, Excel, and PowerPoint
Adobe Reader offers quick functionality for viewing and annotating PDF files.
iLovePDF, the quick way of reading, editing, and converting PDF files
Microsoft Office 2010 has multiple editing and visualization features
Microsoft Excel has enhanced and powerful data-analyzing capabilities
Microsoft Office 2019 is a comprehensive suite of productivity apps